Archived information
This content is archived because Status of Women Canada no longer exists. Please visit the Women and Gender Equality Canada.
Archived information is provided for reference, research or recordkeeping purposes. It is not subject to the Government of Canada Web Standards and has not been altered or updated since it was archived. Please contact us to request a format other than those available.
Status of Women Canada Ministerial Transition Book
Women and Girls in Canada
October 2015
Outline of Presentation
- Overview
- Context
- Canada’s Commitment to Gender Equality
- Diagnostic
- Canada’s Standing Internationally
- Policy Implications
- Moving Forward
- Annexes
Overview
Women are fulfilling an integral role in the country’s success however, persistent challenges remain
- Women are excelling in education, with three quarters of working-age women holding a post-secondary credential
- Gains in educational achievement for women have strengthened their labour force participation and earning potential, yet women remain under-represented in certain sectors and professions
- More women than ever before are engaged in Canada’s workforce (48% of the workforce)
- Women’s participation in the labour force is at an all-time high, while they are still maintaining a primary role in caregiving for children, the sick and elderly. Yet, women continue to earn less than their male counterparts
- Increasing gains in leadership roles in corporate Canada can translate into significant economic gains. Of Canada’s FP500 companies, those with the highest representation of women demonstrated a 26% higher return on investments
- Women are demonstrating growing interest in politics and leadership, yet the interest is not translating into their representation in positions of influence, and is not expected to shift in the foreseeable future
- Women and girls are disproportionately victims of spousal and sexual violence and there is growing recognition of significant social and economic costs, including in the workplace.
- Despite all of the gains for women in education, employment and leadership, rates of violence and harassment remain high
The call to action has been issued on many fronts
“We aspire to a society where men and women enjoy the same opportunities… we cannot break gender stereotypes if gender equality is only pushed by women, for women, without engaging men.”

“I'm challenging everyone in this province to step up and help end sexual violence...If we just talk about what’s comfortable, we’re not going to change anything.“

“The economic success of countries and companies can be tied to the opportunities available for women... There is work to be done by both governments and individuals.”

“In too many countries, too many legal restrictions conspire against women to be economically active. In a world in search of growth, women will help find it, if they face a level playing field instead of an insidious conspiracy.”
Context: The Canadian Picture
Medium term economic prospects are uncertain, and key socio-demographic shifts will continue
- A shift in the nature of work, particularly self-employment and part-time work, will have long-term economic implications for Canada
- Changes in the available workforce and worker demographics will continue to transform the Canadian workplace
- “Double bind” of maintaining paid work while providing care (child or elder) duties will increase
- Aging population will increase pressures on social benefits and pension programs
- Growing diversity and significant regional variation will challenge one size-fits all programs and policies
- Disruptive technologies and social media will continue to change the way Canadians work and live, and how government engages with Canadians
Education and Skills Training
Women have expanded their skills and competencies to achieve employment and financial gains…
- 75% of working-age women hold a post-secondary degree, as compared to 65% of men
- Women are the majority of students in most master’s programs; however, representation is significantly lower in some STEM fields, including mathematics/computer science at 36% and architecture and engineering at 30%
- Women educated in STEM are more likely to go on to careers in other disciplines
- Women are over-represented in humanities, arts and services sectors where attachment to the labour force can be more tenuous and lower paid
- Women face barriers to enter in-demand (and male-dominated) professions, including:
- Lack of information and training geared to women
- At the apprentice stage, difficulty finding an employer sponsor
…however, gaps remain for women’s participation in many in-demand sectors
Employment and Economic Prosperity
Women have reached near parity to men in labour market participation…
- When it comes to the salary gap between the sexes, women have hit a brick wall
- Aggregate analysis of the gender wage gap masks pronounced differences within some in-demand sectors, including many trades
- With a gender wage gap of 19.2%, Canada ranks 10thout of 15 comparable G20-countries for the gender wage gap, behind Mexico, Indonesia and the UK
- Some contributing factors to the gender wage gap include:
- Women’s over-representation in part-time work. Roughly 70% part-time workers are women
- Women’s employment remains concentrated in lower paying traditional sectors (retail, etc)
- Women’s ability to work and the nature of their jobs are constrained
- Canada’s childcare and parental benefits lag behind those of comparable economies
- Women are leaving some sectors as quickly as they enter, particularly in some male-dominated sectors. Work-life balance, career stagnation, work culture and harassment are cited as reasons
- More women are choosing entrepreneurship and self-employment, where statistically, they earn less than their male counterparts
… however, women are underpaid relative to their male counterparts, with Canada falling below the OECD average for the gender wage gap
Leadership and Democratic Participation
More women are taking their place around the board table, within executive ranks and in the political sphere…
- While board gender diversity improves organizations’ overall resilience, innovation and effectiveness, women represent just 16% of FP500 board members, and 40% of FP500 companies have no women on their boards
- In sectors of the economy that have increased gender diversity, women are less likely to be seen in senior, “bottom line” positions at the executive level and on boards
- Myths on the availability and suitability of women for these roles remain pervasive, indicating that recruitment practices need to change
- At the executive level, some women are opting out of advancement opportunities due to workplace culture and expectations
- Representation in politics remains low. Within federal politics, 26% of MPs are women.
… however, until workplace culture and societal attitudes change, progress will be slow
Violence and Harassment
Despite gains across every domain of women’s lives in Canada, gender-based violence and harassment remain pervasive…
- While rates of violence against men in Canada have diminished over time, rates of violence against women have not decreased to the same extent, and reporting has not increased
- Under-reporting remains high and masks the true extent and nature of all forms of violence against women and girls
- The justice system is not meeting the needs of women survivors of violence
- Harassment and violence against women also have economic impacts
- In addition to significant health and policing dollars spent each year, they also result in lost productivity and diminished workplace effectiveness
- Social media creates new threats and sources of violence (cyberbullying) but also constitutes a powerful tool to raise awareness and mobilize action to prevent violence
- While the majority of perpetrators of violence against women and girls are men, the majority of men are not perpetrators of violence
- Strategies to engage men and boys on speaking out against violence are gathering momentum
…raising questions about how best to make violence socially unacceptable in Canadian society
Marginalized Women Face Additional Challenges
While the story of Canadian women is overall positive, key variables place some groups of women on a different trajectory…
Northern and Rural Women
- Women in the North are far more likely to experience violence and poverty
- Access to housing remains a significant challenge in the North and certain rural areas of Canada including the Atlantic and Northern Ontario/Quebec
- Women in rural areas are more likely to be elderly and to be living in poverty
Immigrant Women
- Have lower rates of labour force participation and employment than other women. In addition, they have higher rates of unemployment
- May be more vulnerable to spousal violence due to economic dependence, language barriers, and a lack of knowledge about community resources
Women with Disabilities
- Have poorer labour market outcomes than either men with disabilities or women without disabilities, with one exception that women with disabilities have lower unemployment rates than men with disabilities
Aboriginal Women
- Are three times more likely to experience violence than non-Aboriginal women, in addition to homicide rates far beyond the national average
- Experience higher rates of mental illness and poorer overall health
- Have much lower rates of graduation
- More likely to experience housing insecurity, which is an important precursor to employment
…resulting in unequal outcomes for marginalized women
Canada’s Standing Internationally
According to the World Economic Forum Global Gender Gap Report (2014), Canada ranks 19th of 142 countries for gender equality...
- Canadian women have the highest tertiary education attainment rate (55%) among women or men from OECD countries, but men are more likely to be employed (84.7% vs. 78.5% for women)
- At 68 per cent, Canada’s labour force participation rate for women aged 15 to 74 ranked fourth in the OECD and was 9% higher than the OECD average (59%)
However, Canada is falling behind on key indicators:
- Canadian men are paid 20% more than their female colleagues, a full 2 percentage points above the OECD average of 18%. Only Korea, Japan and Germany rank higher than Canada on the gender pay gap
- In 2014, Canada came in 52ndon the ranking of gender equality in Parliament, with 25 female legislators for every 75 males
- Canada’s investments in childcare payments and parental leave benefits are 17% less than the average of comparable industrialized economies
- Canada has no comprehensive national strategy to address violence against women, lagging behind several comparable countries, including the UK, Ireland, Australia and New Zealand
Canada’s Commitment to Gender Equality
Canada’s commitment to gender equality is longstanding and firmly entrenched…
International Commitments
- United Nations Convention on the Elimination of All Forms of Discrimination against Women
- Signatories to take measures to reduce discrimination in political, economic and social life
- Beijing Platform for Action (Fourth World Conference on Women, 1995)
- Progress reviewed at the United Nations Commission on Status of Women every five years
Legislative Protections
- The Canadian Charter of Rights and Freedoms
- Canadian Human Rights Act (CHRA)
- Provincial and territorial human rights legislation
- Canada Labour Code and provincial/territorial labour protections (employment equity)
Policies and Guidelines
- Federal Plan for Gender Equality (1995)
- Articulates a systematic approach to gender equality and has as its first objective, the implementation of gender-based analysis throughout the federal government
- P/T Gender Equality frameworks and policies
- Individual Federal Departments and agencies hold the levers for gender equality
- Status of Women Canada works to support the federal family to uphold these commitments
…but more could be done
If current trends continue...
If governments take no action, letting Canadian society and the market set the course in the coming years…
Employment
- RBC estimates that the annual lost income potential of Canadian women as a result of unequal income and labour force participation rates is $125.8 billion (not adjusted for inflation)
Leadership
- At the current rate of change, the board gender gap (40% women) will not be resolved until 2097, representing countless dollars lost in revenue and organizational effectiveness
Violence
- The World Health Organization estimates that 1 in 4 Canadian women will experience sexual violence in their lifetime, with numbers set to increase without coordinated action
- Spousal and sexual violence in Canada costs an estimated $9.3 billion per year, with women making up the majority of victims. By 2035, this would represent $186 billion in tax expenditures (not adjusted for inflation)
…these significant challenges will limit Canada’s social and economic potential
If Governments Act as a Catalyst
While the scope, type and pace of investments could vary…
- Closing the gender pay gap could result in as much as a 10% growth in GDP and more access to better-paid jobs, which increases wealth
- If women’s labour force participation, employment rates and average incomes equalled those of men, personal incomes would be roughly $168 billion higher-a significant and positive impact on the country’s productivity rate and quality of life
- A recent study in Alberta suggests that for every $1 invested in violence prevention programs, $20 would be returned to the economy
- Every $1 invested in child care in Canada is estimated to increase the country’s economic output (GDP) by $2.30
…investing in key issues that affect women and girls will bolster the economy and improve the lives of all Canadians
International Best Practices
| Lever | Examples |
|---|---|
| Legislative Measures |
|
| Tax Incentives |
|
| Grants and Loans |
|
| Policies |
|
| Social Marketing |
|
Annexes
Education and Skills Training
Employment and Economic Prosperity
- Gender wage gap by skill type
- OECD data on participation and wage gap
- Lone parent families and low income
- Senior women and low income
- Women and part-time work
- Women and caregiving
Leadership and Democratic Participation
- Women in executive roles
- Women in board governance
- OECD data on women on boards
- Women in federal appointments
- Women in senior federal government roles
- Women’s political participation
- OECD data for political participation
Violence and Harassment
- Rates of violent crime not decreasing at same rate for women
- Violence against women often not reported
- Rates of sexual violence largely unknown
- Impacts of spousal violence
- Costs of spousal violence
Education and Skills Training: Women and PSE Attainment
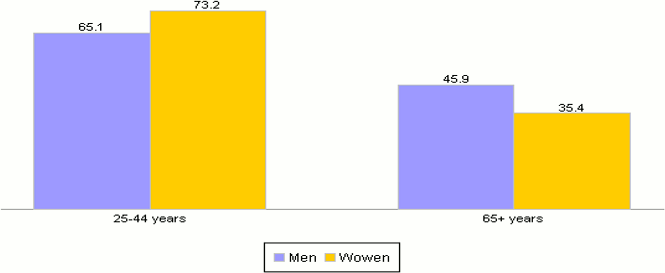
- In 2012, more women (73.2%) than men (65.1%) aged 25 to 44 years had completed post-secondary education.
- The percentages for this age group are in stark contrast to those of the group 65 years of age and over, in which only 35.4% of women and 45.9% of men had completed post-secondary education.
- Women have demonstrated significant improvement in rates of PSE attainment in a relatively short period of time.
Completion of post-secondary education, by age and gender, 2012
(percent)
Source: HRSDC calculations based on Statistics Canada. Table 282-0004 -Labour force survey estimates (LFS), by educational attainment, sex and age group, annual (persons unless otherwise noted), CANSIM (database).
[Text version of the graphic Completion of post-secondary education, by age and gender, 2012 (percent) ]
| Men | Women | |
|---|---|---|
| 25-44 years | 65.1 | 73.2 |
| 65+ years | 45.9 | 35.4 |
Education and Skills Training: Women in STEM
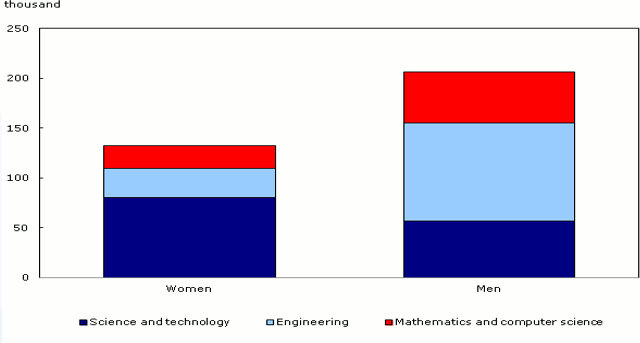
Women accounted for 59% of graduates who had a university degree in science and technology, but accounted for 23% of graduates aged 25 to 34 with a university degree in engineering, and 30% of those with a degree in mathematics and computer science.
Thus, 39% of the 132,500 women aged 25 to 34 who had a STEM degree had a background in engineering, mathematics or computer science.
Number of STEM university graduates aged 25 to 34, by sex, 2011
Note: STEM includes science, technology, engineering, mathematics and computer science.
Source: Statistics Canada, National Household Survey, 2011.
[Text version of the graphic Number of STEM university graduates aged 25 to 34, by sex, 2011]
The image is a bar graph. It displays two bars—the one on the left is for women and the one on the right is for men. Each bar contains three colours. Bright blue represents science and and technology, light blue represents engineering and red represents mathematics and computer science.
The bar representing women shows that fewer than 150,000 STEM graduates in 2011 were women (approximate). Of these, the majority graduated from science and technology. A much smaller number graduated from engineering and fewer still graduated from mathematics and computer science.
The bar representing men shows that just over 200,000 men graduated from the STEM disciplines in 2011 (approximate). Of these, the majority graduated from engineering, with fewer graduating from science and technology and fewer still graduating from mathematics and computer science.
Education and Skills Training: Women in the Trades
Health, engineering and computing are the fields that tend to be most affected by skills pressures. These professions also have high rates of gender polarization.
Evidence suggests that career aspirations and expectations associated with future careers are formed at a relatively young age and differ dramatically by gender.
This trend exists across all OECD countries.
% of 15-year-olds planning a career in health services, engineering or computing

Sources: OECD Education at a Glance, 2012
[Text version of the graphic % of 15-year-olds planning a career in health services, engineering or computing]
| Girls | Boys | |
|---|---|---|
| Health services | 25.8 | 11.6 |
| Engineering or computing | 3.2 | 18.8 |
Employment and Economic Prosperity: Wage Gap by Skill Type
When it comes to the salary gap between the sexes, women have hit a brick wall.
Women between the ages of 45 and 54 earn on average about $23,600 less than men in that same cohort, which is virtually unchanged from where it was five years ago, although the gap is narrower than in 2000.
The gender wage gap is more pronounced in certain sectors, as outlined below.
| Skill types** | Men | Women | Ratio (W/M) |
|---|---|---|---|
| Hourly rate in current dollars | |||
| Health occupations | $28.6 | $27.6 | 0.97 |
| Arts, culture, recreation and sport | $27.1 | $25.4 | 0.94 |
| Natural and applied sciences and related occupations | $34.5 | $30.7 | 0.89 |
| Social science, education, government services and religion | $33.2 | $29.6 | 0.89 |
| Management occupations | $39.6 | $34.5 | 0.87 |
| Business, finance and administrative occupations | $26.1 | $22.3 | 0.85 |
| Trades, transport and equipment operators | $24.8 | $19.5 | 0.79 |
| Sales and services | $21.1 | $15.9 | 0.75 |
| Processing, manufacturing and utilities | $22.1 | $16.2 | 0.73 |
| Occupations unique to primary industries | $24.8 | $16.4 | 0.66 |
Source: Statistics Canada, Labour Force Survey* Workers aged 25–54
Employment and Economic Prosperity: OECD Wage and Labour Force Participation Data
With a gender gap difference of 7.3% between male and female labour force participation rates, Canada has the lowest gender difference in participation rate (age 15–64) among G20 countries.
With a gender wage gap of 19.2%, Canada ranks 10th out of 15 G20-countries for which comparable data is available.

Source: G20 labour markets: outlook, key challenges and policy responses, ILO, OECD, World Bank, 2014
[Text version of the graphic Labour Market Participation Gender Gap - OECD Countries
The image is a bar graph illustrating the gap in labour market participation between men and women in the following countries, in order of smallest gap to largest gap: Canada (less than approx. 10%), France, Germany, Russian Federation, Spain, United Kingdom, United States, Australia, European Union, South Africa, China, Japan, Italy, Republic of Korea, Brazil, Argentina, Indonesia, Mexico, Turkey, India and Saudi Arabia (nearly 60%).
[Text version of the graphic Gender Wage Gap - OECD Countries
The image is a bar graph illustrating the wage gap between men and women in OECD countries. They are listed from smallest gap to largest in the following order: Spain (just under 10%), Italy, European Union, Germany, Australia, France, Mexico, Indonesia, United Kingdom, Canada (just under 20%), United States, Turkey, Japan, Republic of Korea and the Russian Federation (just under 40%).
Employment and Economic Prosperity: Lone-parent families and low income
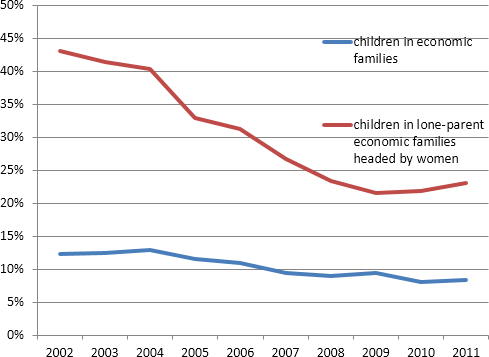
- In 2011, there were 863,000 children living in lone-parent economic families headed by a female.
- This represents 82.3% of all children living within any type of lone-parent family.
- The incidence of low income (LICO-AT) for children in lone-parent economic families headed by women has decreased since 2002.
- Between 2009 and 2011, there was a modest increase in LICO-AT incidence amongst these children, possibly reflecting some of the negative post-recessionary effects during this period.
Low-income rates among children living in the lone parent economic families headed by women, after-tax LICOs (2011)
Source: Statistics Canada, CANSIM table 202-0802.
[Text version of the graphic Low-income rates among children living in the lone parent economic families headed by women, after-tax LICOs (2011)
The image is a line graph illustrating the incidence of low-income for children living in economic families (blue line), versus children in lone-parent families headed by women (red line) from 2002 to 2011. It shows that, while the incidence of low income has dropped significantly over time for children in lone-parent families headed by women (from nearly 45% in 2002 to less than 25% in 2011), children from these families are still much more likely to be low income compared to children from other families, whose rate of low income in 2011 was less than 10%. The graph also shows that the rate of low income for children in economic families has remained much more stable since 2002, at which time was just over 10%.
Employment and Economic Prosperity: Senior Women and Low Income
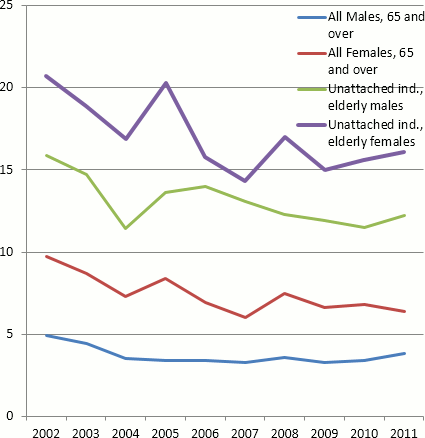
- Elderly unattached females experience low income more prevalently than elderly unattached males.
- Between 2009 and 2011, there was substantial increase in low income incidence for unattached elderly females (from 15% to 16.1%).
- Higher poverty among older women reflects lower wages, more part-time work and career gaps during women’s working lives (OECD, 2013)
Low income rates, males and females over 65, after-tax LICOs
Source: ESDC, 2012
[Text version of the graphic Low income rates, males and females over 65, after-tax LICOs
The image is a line graph illustrating the rates of low income for the following groups from 2002 to 2011: all males, 65 and over; all females, 65 and over; unattached individual elderly males; and unattached individual elderly females.
It shows that unattached individual elderly females have the highest rate of low income (just over 20% in 2002 and just over 15% in 2011), followed by unattached individual elderly males (just over 15% in 2002 and just over 10% in 2011). It also shows that all females over the age of 65 have a higher rate of low income (over 5 % in 2011) than all males over 65 (less than 5% in 2011).
Employment and Economic Prosperity: Women and Part-time Work
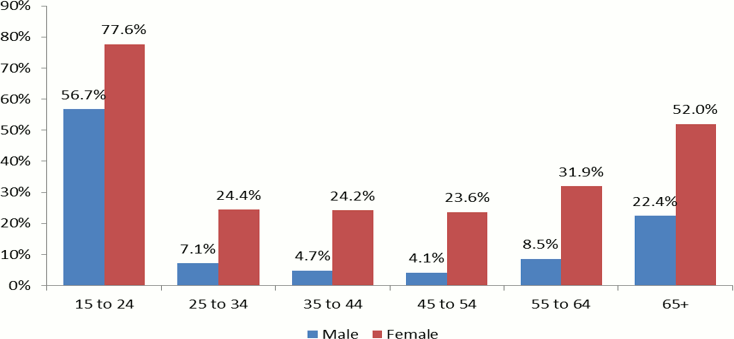
- Females represent a large share of permanent part-time work. In 2013, the proportion of females in permanent part-time work was 70.8% (approximately 1.4 million). In comparison, the proportion of females in permanent full-time work was 45.6%.
- In 2013, 21.4% of all female permanent workers were part-time workers, compared to 8.6% of all male permanent workers.
Source: Statistics Canada, Labour Force Survey, 2013.
[Text version of the graphic Employment and Economic Prosperity: Women and Part-time Work]
| Male | Female | |
|---|---|---|
| 15 to 24 | 56.7% | 77.6% |
| 25 to 24 | 7.1% | 24.4% |
| 35 to 44 | 4.7% | 24.2% |
| 45 to 54 | 4.1% | 23.6% |
| 55 to 64 | 8.5% | 31.9% |
| 65+ | 22.4% | 52.0% |
Employment and Economic Prosperity: Women and Caregiving
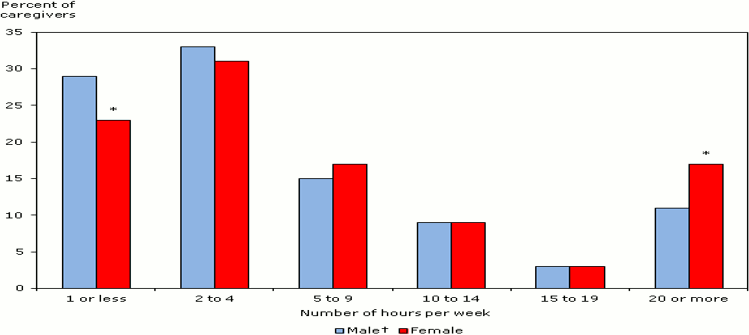
Women are more likely than men to be providing care, whether for a child or loved one.
Women are also more likely to experience work related repercussions due to their caregiving responsibilities, including missed time and reduction of hours.
Women spend more hours than men caregiving
† reference category
* significantly different from reference category (p < 0.05)
Source: Statistics Canada, General Social Survey, 2012.
[Text version of the graphic Women spend more hours than men caregiving]
The image is a bar graph illustrating the number of hours spent per week by men and women on caregiving. The graph shows that more female caregivers (more than 15%) than male caregivers (10%) are spent 20 hours or more per week caregiving. It also shows that fewer women (less than 25%) than men (nearly 30%) spent one hour or less per week on caregiving.
Leadership and Democratic Participation: Women in Executive Roles
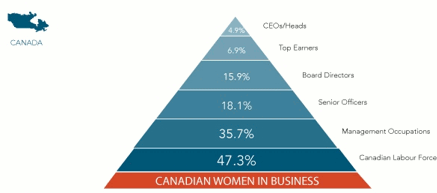
Women's participation rate in business and finance increased more than 44% from 1987 (38.3%) to 2009 (55.2%).
In 2009, women comprised 37% of managers, up nearly 23% from 30.1% in 1979.
Source: Catalyst, 2015
[Text version of the graphic Women spend more hours than men caregiving]
| Canadian Women in Buisness | Percentages |
|---|---|
| Canadian Labour Force | 47.3% |
| Management Occupation | 35.7% |
| Senior Officers | 18.1%% |
| Board Directors | 15.9% |
| Top Earners | 6.9% |
| CEOs/Heads | 4.9% |
Leadership and Democratic Participation: Women in Board Governance
Source: Catalyst, 2015
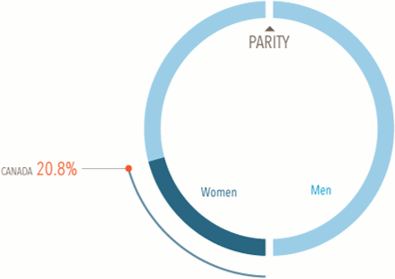
- Currently there is only one woman head on the TSX 60.
- Women hold just 20.8% of board seats at Canadian Stock Index Companies.
- Denmark, France, Norway, Sweden, and the United Kingdom have a higher percentage of board seats held by women.
Women's Representation on Canadian Stock Index Boards
Source: Catalyst, 2015
[Text version of the graphic Women's Representation on Canadian Stock Index Boards]
The image is a graphic of a circle. The top-centre of the circle is labeled “parity”. The bottom-left portion of the circle is shaded and labeled “women, 20.8%”. The right portion of the circle is not shaded and is labeled “men”.
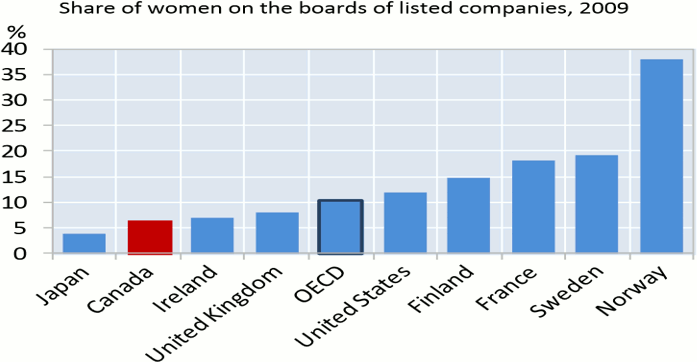
Leadership and Democratic Participation: Canada below OECD avg. for women on boards
While Canada’s standing has improved since the last OECD analysis of women’s representation on corporate boards in 2009, we continue to remain below the OECD average.
Women are underrepresented on company boards
OECD data, 2012
[Text version of the graphic Share of women on the boards of listed companies, 2009]
The image is a bar graph illustrating the percentage of women on boards of listed companies in the following countries, in order of lowest share to greatest: Japan (less than 5%), Canada (just over 5%), Ireland, United Kingdom, OECD (about 10%), United States, Finland, France, Sweden and Norway (more than 35%).
Leadership and Democratic Participation: Women in Federal Government Appointments
As of June 30, 2015 women represented 34% of GIC appointments.
| Sector | % of Women Appointed |
|---|---|
| Total: | 34% |
| Administrative Tribunals | 37% |
| Agencies, Boards and Commissions | 33% |
| Crown Corporations | 33% |
| Deputy Ministers | 42% |
| Diplomatic Appointments | 28% |
| Judicial Appointments | 34% |
Leadership and Democratic Participation: Women in Senior Federal Government Positions
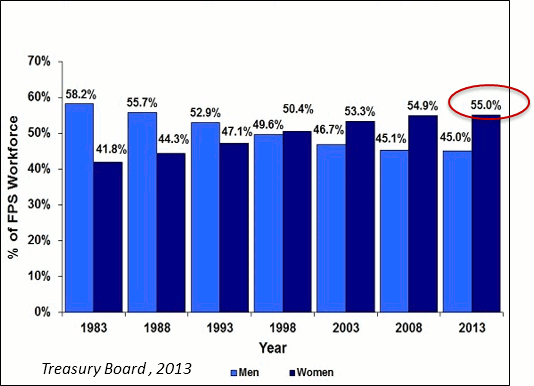
While women’s representation within the federal public service has increased significantly over the last 30 years, the same level of representation does not extend to executive ranks.
Though women represent 55% of public service employees, they represent 42% of senior government executives.
Figure 2: Proportion of Men and Women in the Federal Public Service (FPS) - Select Years, 1983 to 2013
Treasury Board, 2013
[Text version of the graphic Figure 2: Proportion of Men and Women in the Federal Public Service (FPS) - Select Years, 1983 to 2013]
| Year | Men | Women |
|---|---|---|
| 1983 | 58.2% | 41.8% |
| 1988 | 55.7% | 44.3% |
| 1993 | 52.9% | 47.1% |
| 1998 | 49.6% | 50.4% |
| 2003 | 46.7% | 53.3% |
| 2008 | 45.1% | 54.9% |
| 2013 | 45.0% | 55.0% |
| Place | Sex | EX03 | EX04 | EX05 | Total | % |
|---|---|---|---|---|---|---|
| Core Public Service | Male | 492 | 118 | 48 | 658 | 58% |
| Female | 354 | 85 | 32 | 471 | 42% | |
| Total | 846 | 203 | 80 | 1,129 | ||
| Agencies | Male | 143 | 30 | 34 | 207 | 59% |
| Female | 101 | 30 | 12 | 143 | 41% | |
| Total | 244 | 60 | 46 | 350 | ||
| Total Public Service | Male | 635 | 148 | 82 | 865 | 58% |
| Female | 455 | 115 | 44 | 614 | 42% | |
| Total | 1,090 | 263 | 126 | 1,479 |
Treasury Board, 2014
Leadership and Democratic Participation: Women’s Political Participation
Of the 338 MPs elected in the 2015 federal election, 88 are women – or 26% women – up only one percentage point from the last Parliament.
- 33% of all candidates in the federal election were women.
| Seats | Candidates | Results | |
|---|---|---|---|
| Elected | 88 | 338 | 26% |
| Candidates | 472 | 1428 | 33.1% |
Political Representation of Women, Provincial

Equal Voice, 2014
The United Nations defines 30% as the minimum level of women’s representation required, in order for their voices to be heard.
[Text version of the graphic Political Representation of Women, Provincial]
On the y axis are percentages ranging from 0.00 to 100.00. On the x axis, the provinces and territories are listed in the following order (from left to right): Northwest Territories (NWT), Nunavut (NU), Yukon (YK), Newfoundland and Labrador (NL), Prince Edward Island (PEI), New Brunswick (NB), Nova Scotia (NS), Quebec (QC), Ontario (ON), Manitoba (MB), Saskatchewan (SK), Alberta (AB) and British Columbia (BC). Women are represented by a red bar, men by a blue. The data displayed is as follows (percentages are approximate):
- NWT: women 10%; men 90%.
- NU: women 15%; men 85%.
- YK: women 30%; men 70%.
- NL: women 15%; men 85%.
- PEI: women 20%; men 80%.
- NB: women 10%; men 90%.
- NS: women 25%; men 75%.
- QC: women 27%; men 73%.
- ON: women 35%; men 65%.
- MB: women 25%; men 75%.
- SK: women 18%; men 82%.
- AB: women 25%; men 75%.
- BC: women 35%; men 65%.
The graph is credited to Equal Voice, 2014.
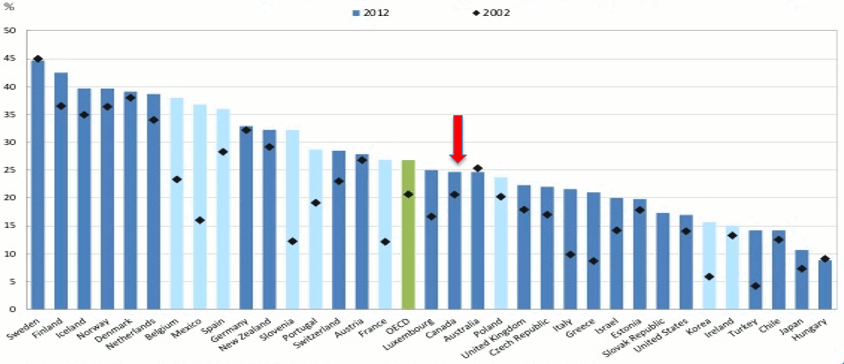
Leadership and Democratic Participation: Canada below OECD Average
Canada is slightly below the OECD average for women’s participation in federal parliaments.
Countries including Rwanda, Bolivia and Cuba rank well ahead of Canada in terms of women’s representation in federal government.
Share of women parliamentarians and legislated gender quotas (2012 and 2002)
Source: Inter-Parliamentary Union (IPU) PARLINE (database), and IDEA Quota Project (database).
[Text version of the graphic Share of women parliamentarians and legislated gender quotas (2012 and 2002)]
The image is a bar graph illustrating the representation of women parliamentarians in percent by country in both 2012 and 2002. Countries are listed from highest representation in 2012 to lowest, in the following order: Sweden (45%), Finland, Iceland, Norway, Denmark, Netherlands, Belgium, Mexico, Spain, Germany, New Zealand, Slovenia, Portugal, Switzerland, Austria, France, OECD, Luxembourg, Canada (nearly 25%), Australia, Poland, United Kingdom, Czech Republic, Italy, Greece, Israel, Estonia, Slovak Republic, United States, Korea, Ireland, Turkey, Chile, Japan and Hungary (nearly 10%).
Violence and Harassment: Rates of Violent Crime Not Decreasing at Same Rate for Women
The downward trend in rates of police-reported violent crimes is not the same for women and men. Between 2009–2013, violent crimes against men declined by 13%, but only by 7% for women.
Factors that may influence this disparity include:
- Nature of violent crimes experienced by women is different than for men. Both men and women are more likely to be victimized by men, with women predominantly victimized in the home, by men that they know.
- Causes of violent crimes against women are different than for men. Experiences of violence are affected by a range of factors, including societal attitudes toward women and violence.
- Responses to address violent crimes are not reflective of women’s experiences, with many approaches being gender-neutral.
| Female Victims | Male Victims | ||
|---|---|---|---|
| Form of Violence | Percent change in rate 2009–2013 | Percent change in rate 2009–2013 | Average Change |
| Homicide | -7.17 | -23.13 | -15.2 |
| Attempted Murder | -10.21 | -20.70 | -15.5 |
| Physical Assault | -13.61 | -19.32 | -16.5 |
| Sexual Assault | 2.24 | 7.82 | 5.0 |
| Average | -7.18 | -13.00 | -10.6 |
Source: Statistics Canada, Canadian Centre for Justice Statistics, Uniform Crime Reporting Trend Survey.
Violence and Harassment: Violence against women often not reported to police
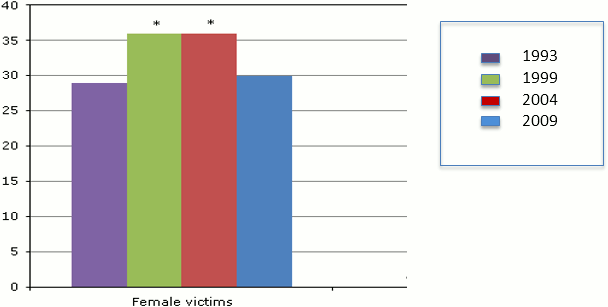
Data on violence against women come from two main sources: police reported data (incidents that are reported to the police) and victimization survey data (conducted once every five years). We know from victimization survey data that women often do not report violence they experience to police.
For spousal violence, victims cite several reasons for this, including that they dealt with the situation in another way or felt that the incident was a personal matter.
Reporting rates of spousal violence to police, by sex of victim, Canada, 1993, 1999, 2004, and 2009
2009 GSS data
[Text version of the graphic Reporting rates of spousal violence to police, by sex of victim, Canada, 1993, 1999, 2004, and 2009]
The image is a bar graph showing the reporting rates of spousal violence to police by female victims in Canada for the years 1993, 1999, 2004 and 2009. The graph shows that 1999 and 2004 had the highest reporting rates with just over 35%. The rate for 1993 was just under 30% and for 2009, approximately 30%.
Violence and Harassment: Rates of Sexual Violence in Canada largely unknown
A significant number of sexual assaults remain unreported.

[Text version of the graphic The Attrition Pyramid]
The image is labeled “The Attrition Pyramid”. It includes the following text: “H. Johnson, (2012). Limits of a criminal justice response: Trends in police and court processing of sexual assault. In Sheehy. E (Ed), Sexual Assault in Canada: Law, Legal Practice, and Women’s Activism. Ottawa: University of Ottawa Press, pp 633-654.
The image is a large triangle divided into seven sections. The bottom of the pyramid contains this text: “Actual incidence of sexual assault: Likely will never be known.” The section above this is labeled as follows: “460,000 reported to survey interviewers; 460,000 estimated sexual assaults in one year based on 2004 General Social Survey.” The third section contains this text: “15,200 reported to police”. It is labeled: “Less than 10% of sexual assaults reported on Victim Surveys were reported to police.” The next section contains this text: “13,200 recorded as crime.” It is labeled: “85% of police reported sexual assaults are recorded as a crime. The next section contains this text: “5,544 charges laid”. It is labeled: 50% of recorded sexual assault crimes result in the suspect being charged”. The next section contains this text: “2,824 prosecuted.” It is labeled: “Less than 50% of suspects were prosecuted.” The tip of the pyramid contains the text: “1,046 convicted”. It is labeled: “25% of those initially charged are convicted of sexual assault.
Violence and Harassment: Impacts of Spousal Violence
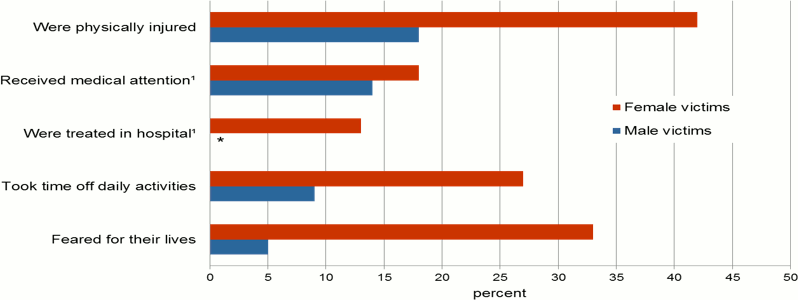
Impact of spousal violence for victims, by sex of victim, Canada, 2009
[Text version of the graphic Impact of spousal violence for victims, by sex of victim, Canada, 2009]
The image is a bar graph. It illustrates the impact of spousal violence on male and female victims in 2009. More than 40% of female victims were physically injured, compared to just under 20% of male victims. More than 15% of female victims received medical attention, compared to just under 15% of men. More than 10% of female victims were treated in hospital; data not reliable for male victims. More than 25% of female victims took time off daily activities, compared to just under 10% of men. More than 30% of female victims feared for their lives, compared to 5% of male victims.
Female victims of spousal violence are twice as likely as male victims to be physically injured, three times as likely to experience disruptions to their daily lives, such as missed days of work, and almost seven times as likely to fear for their life.
Documented physical and mental health impacts include lasting injuries, increased risk of cancer and heart disease, depression, post-traumatic stress disorder and suicide.
* Too unreliable to be published.
1. Includes only those who were physically injured.
Source: Statistics Canada, General Social Survey 2009. Excludes data from the Northwest Territories, Yukon and Nunavut.
Violence and Harassment: The Cost of Spousal Violence
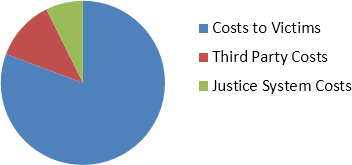
Economic Costs of Spousal Violence in Canada (Justice, 2012)
[Text version of the graphic Economic Costs of Spousal Violence in Canada (Justice, 2012)]
The image is a pie chart illustrating the costs of spousal violence to victims (approximately 75%), the justice system (approximately 10%) and to third parties (approximately 15%).
The economic costs of spousal violence against women in Canada are estimated to be $4.8B annually.
Costs to victims
- The majority of costs are associated with victims seeking medical attention, lost wages, damaged or destroyed property and the “intangibles” of pain and suffering and loss of life.
Costs to third parties
- Third party costs include social service operating costs, losses to employers, the negative impact on children exposed to spousal violence, and other government expenditures.
Costs to the justice system
- Costs borne by the criminal justice system include police, court, prosecution, legal aid and correctional services. Civil justice system costs include civil protection orders, divorces and separations and child protection systems.
Source: Zhang, Ting, Josh Hoddenbagh, Susan McDonald, and Katie Scrim. 2012. An Estimation of the Economic Impact of Spousal Violence in Canada,
- Date modified: