Archived information
This content is archived because Status of Women Canada no longer exists. Please visit the Women and Gender Equality Canada.
Archived information is provided for reference, research or recordkeeping purposes. It is not subject to the Government of Canada Web Standards and has not been altered or updated since it was archived. Please contact us to request a format other than those available.
Analysis of trends in spending and human resources
Actual expenditures
Departmental spending trend graph
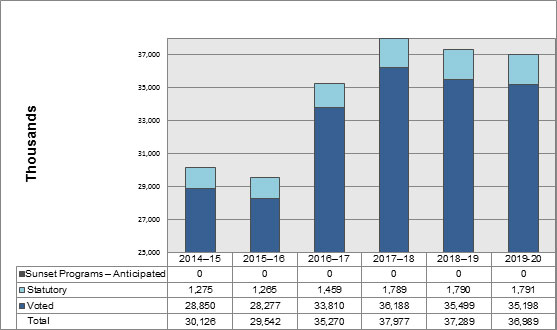
Long description
| Fiscal year | Total | Voted | Statutory | Sunset Programs – Anticipated |
|---|---|---|---|---|
| 2014-15 | 30,126 | 28,850 | 1,275 | 0 |
| 2015-16 | 29,542 | 28,277 | 1,265 | 0 |
| 2016-17 | 35,270 | 33,810 | 1,459 | 0 |
| 2017-18 | 37,977 | 36,188 | 1,789 | 0 |
| 2018-19 | 37,289 | 35,499 | 1,790 | 0 |
| 2019-20 | 36,989 | 35,198 | 1,791 | 0 |
In 2016-17, SWC spent a total of $35,269,616 ($20,480,000 was for grants and contributions) to carry out its programs, achieve expected results and advance its strategic outcome. The increase in spending from the prior year is from Budget 2016 to increase capacity at SWC in order to deliver on increased responsibilities and accountabilities.
| Programs and Internal Services | 2016–17 Main Estimates | 2016–17 Planned spending | 2017–18 Planned spending | 2018–19 Planned spending | 2016–17 Total authorities available for use | 2016–17 Actual spending (authorities used) | 2015–16 Actual spending (authorities used) | 2014–15 Actual spending (authorities used) |
|---|---|---|---|---|---|---|---|---|
| Strategic Advice, Expertise and Promotion of Gender Equality | 2,144,659 | 2,144,659 | 3,153,970 | 3,153,970 | 3,526,759 | 2,890,415 | 1,852,185 | 2,004,692 |
| Advancing Equality for Women | 25,341,251 | 25,341,251 | 28,798,443 | 28,110,492 | 25,840,651 | 25,199,902 | 22,459,620 | 22,783,283 |
| Subtotal | 27,485,910 | 27,485,910 | 31,952,413 | 31,264,462 | 29,367,410 | 28,090,317 | 24,311,805 | 24,787,975 |
| Internal Services | 4,250,414 | 4,250,414 | 6,025,008 | 6,025,008 | 6,970,323 | 7,179,299 | 5,230,596 | 5,337,769 |
| Total | 31,736,324 | 31,736,324 | 37,977,421 | 37,289,470 | 36,337,733 | 35,269,616 | 29,542,401 | 30,125,744 |
Actual human resources
| Programs and Internal Services | 2014–15 Actual | 2015–16 Actual | 2016–17 Planned | 2016–17 Actual | 2017–18 Planned | 2018–19 Planned |
|---|---|---|---|---|---|---|
| Strategic Advice, Expertise and Promotion of Gender Equality | 17 | 17 | 18 | 19 | 24 | 24 |
| Advancing Equality for Women | 39 | 38 | 38 | 43 | 55 | 55 |
| Subtotal | 56 | 55 | 56 | 62 | 79 | 79 |
| Internal Services | 42 | 44 | 42 | 51 | 57 | 57 |
| Total | 98 | 99 | 98 | 113 | 136 | 136 |
For the past three years including 2016-17, full-time equivalents (FTE) have remained stable. The planned increase for future years comes from Budget 2016 announcement to increase capacity at SWC in order to deliver on increased responsibilities and accountabilities. A total of 38 FTE will be added by the end of 2017-18 fiscal year.
Expenditures by vote
For information on the Status of Women Canada’s organizational voted and statutory expenditures, consult the Public Accounts of Canada 2017 Endnote xiv .
Alignment of spending with the whole-of-government framework
| Program | Spending area | Government of Canada activity | 2016-17 Actual spending |
|---|---|---|---|
| Strategic Advice, Expertise and Promotion of Gender Equality | Government Affairs | A transparent, accountable and responsive federal government | 2,890,415 |
| Advancing Equality for Women | Economic Affairs | Income security ad employment for Canadians | 25,199,902 |
| Spending area | Total planned spending | Total actual spending |
|---|---|---|
| Economic affairs | 25,341,251 | 25,199,902 |
| Social affairs | 0 | 0 |
| International affairs | 0 | 0 |
| Government affairs | 2,144,659 | 2,890,415 |
Financial statements and financial statements highlights
Financial statements
The Status of Women Canada’s financial statements [unaudited] for the year ended March 31, 2017, are available on the departmental website Endnote xvi .
Financial statements highlights
| Financial information | 2016-17
Planned results |
2016-17
Actual |
2015-16 Actual |
Difference (2016-17 actual minus 2016-17 planned) | Difference (2016-17 actual minus 2015-16 actual) |
|---|---|---|---|---|---|
| Total expenses | 33,241,000 | 36,301,531 | 30,914,076 | 3,060,531 | 5,387,455 |
| Total revenues | 0 | 0 | 89 | 0 | (89) |
| Net cost of operations before government funding and transfers | 33,241,000 | 36,301,531 | 30,913,987 | 3,060,531 | 5,387,544 |
| Financial Information | 2016-2017 | 2015-2016 | Difference (2016-17 minus 2015-16) |
|---|---|---|---|
| Total net liabilities | 2,246,896 | 2,155,968 | 90,928 |
| Total net financial assets | 1,333,183 | 1,382,726 | (49,543) |
| Departmental net debt | 913,713 | 773,242 | 140,471 |
| Total non-financial assets | 1,427,374 | 491,603 | 935,771 |
| Departmental net financial position | 513,661 | (281,639) | 795,300 |
- Date modified: